

Power Perspectives

US electricity generation broke out of a twenty year range last year, and reached a new all-time high. Since the year 2000, annual US power generation has roughly oscillated between 3800 and 4100 terawatt hours (TWh). Last year, output reached over 4300 TWh; an upside spike that likely heralds a new growth phase in US power. As we know, the project of decarbonization largely involves moving tranches and tranches of energy demand over to powergrids which are concurrently transitioning to clean sources. The US is in the early phases of this transformation. Wind and solar now compose nearly 15% of total electricity output, and layer by layer, everything from transportation to heating will be electrified. As the American fleet of EV, heat pumps, and electrified buildings rolls out, total power demand will of course rise further. There is no question the US will eventually consume 5000 TWh of power (and likely more) and the bulk of that new generation will come from wind, solar, and batteries—the energy triumvirate of better, faster, cheaper.
To illustrate, let’s use a chart that does double-duty, showing both total power generation and the share taken by wind+solar. The bold numbers on the far right indicate total power generation. Last year the US generated 4302 TWh in total, but note the steady creep of the orange bars—those represent combined wind+solar. | for the interactive version of the chart that displays all numbers when you hover, click directly on the chart below which will take you to Datawrapper where the chart is hosted.

Just a word of caution, however. As The Gregor Letter has laid out over recent issues, the advent of more rapid growth in US electricity demand is yet another warning to curb the ascent of natural gas. Without both new nuclear on the supply side, and more efficient buildings and heating on the demand side, combined wind+solar+batteries will not, by themselves, be able to cover all the growth that is certain to come in US power. Put another way, even if combined wind+solar+batteries were able to cover all marginal growth in US power, without new nuclear or very significant demand side changes, fossil fuel emissions from the power sector will not decline.
The trajectory of US emissions is no longer encouraging. For ten years, from the highs of 2007 through 2017, US CO2 emissions from energy combustion fell from 6016 to 5131 million tonnes. This was a robust period for the first wave of wind and solar growth, combined with rapid retirements of coal-fired power, and importantly, during a time when total US electricity demand was not growing. Notice however that after 2017, even as wind and solar continued to grow and coal continued to die, the path of US emissions changed, and stopped declining as much. 2022, which was still a year of economic recovery, saw emissions rise again to nearly 5000 tonnes, barely below the highs of 2018 and 2019.
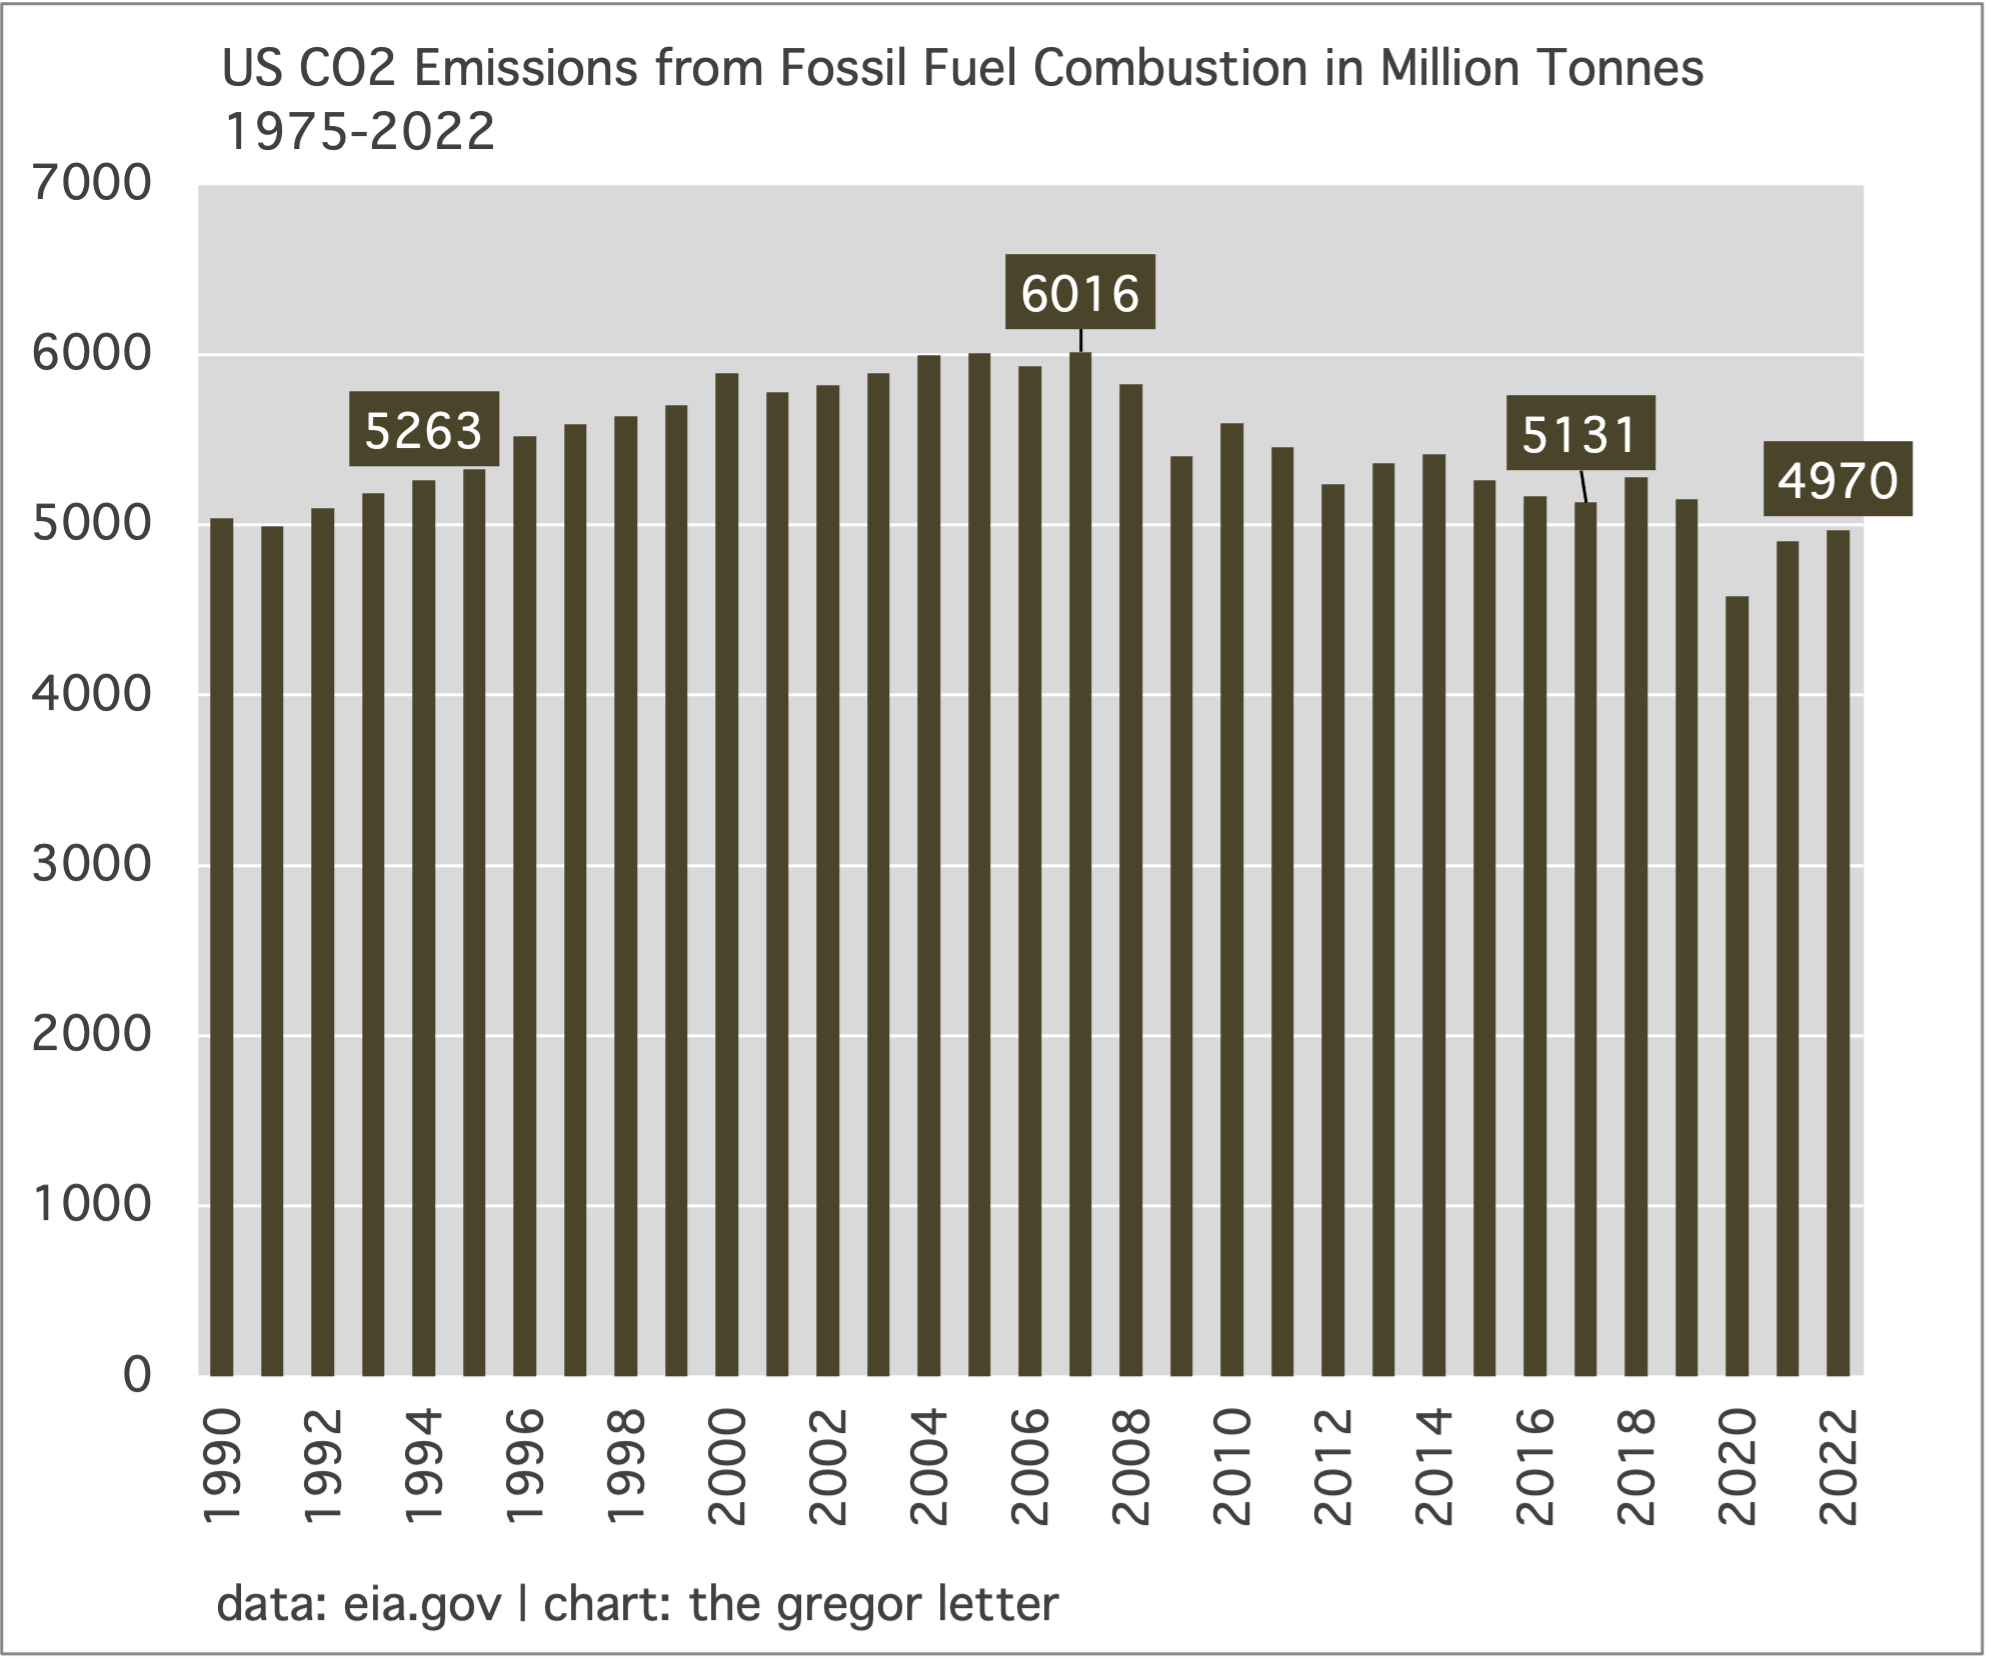
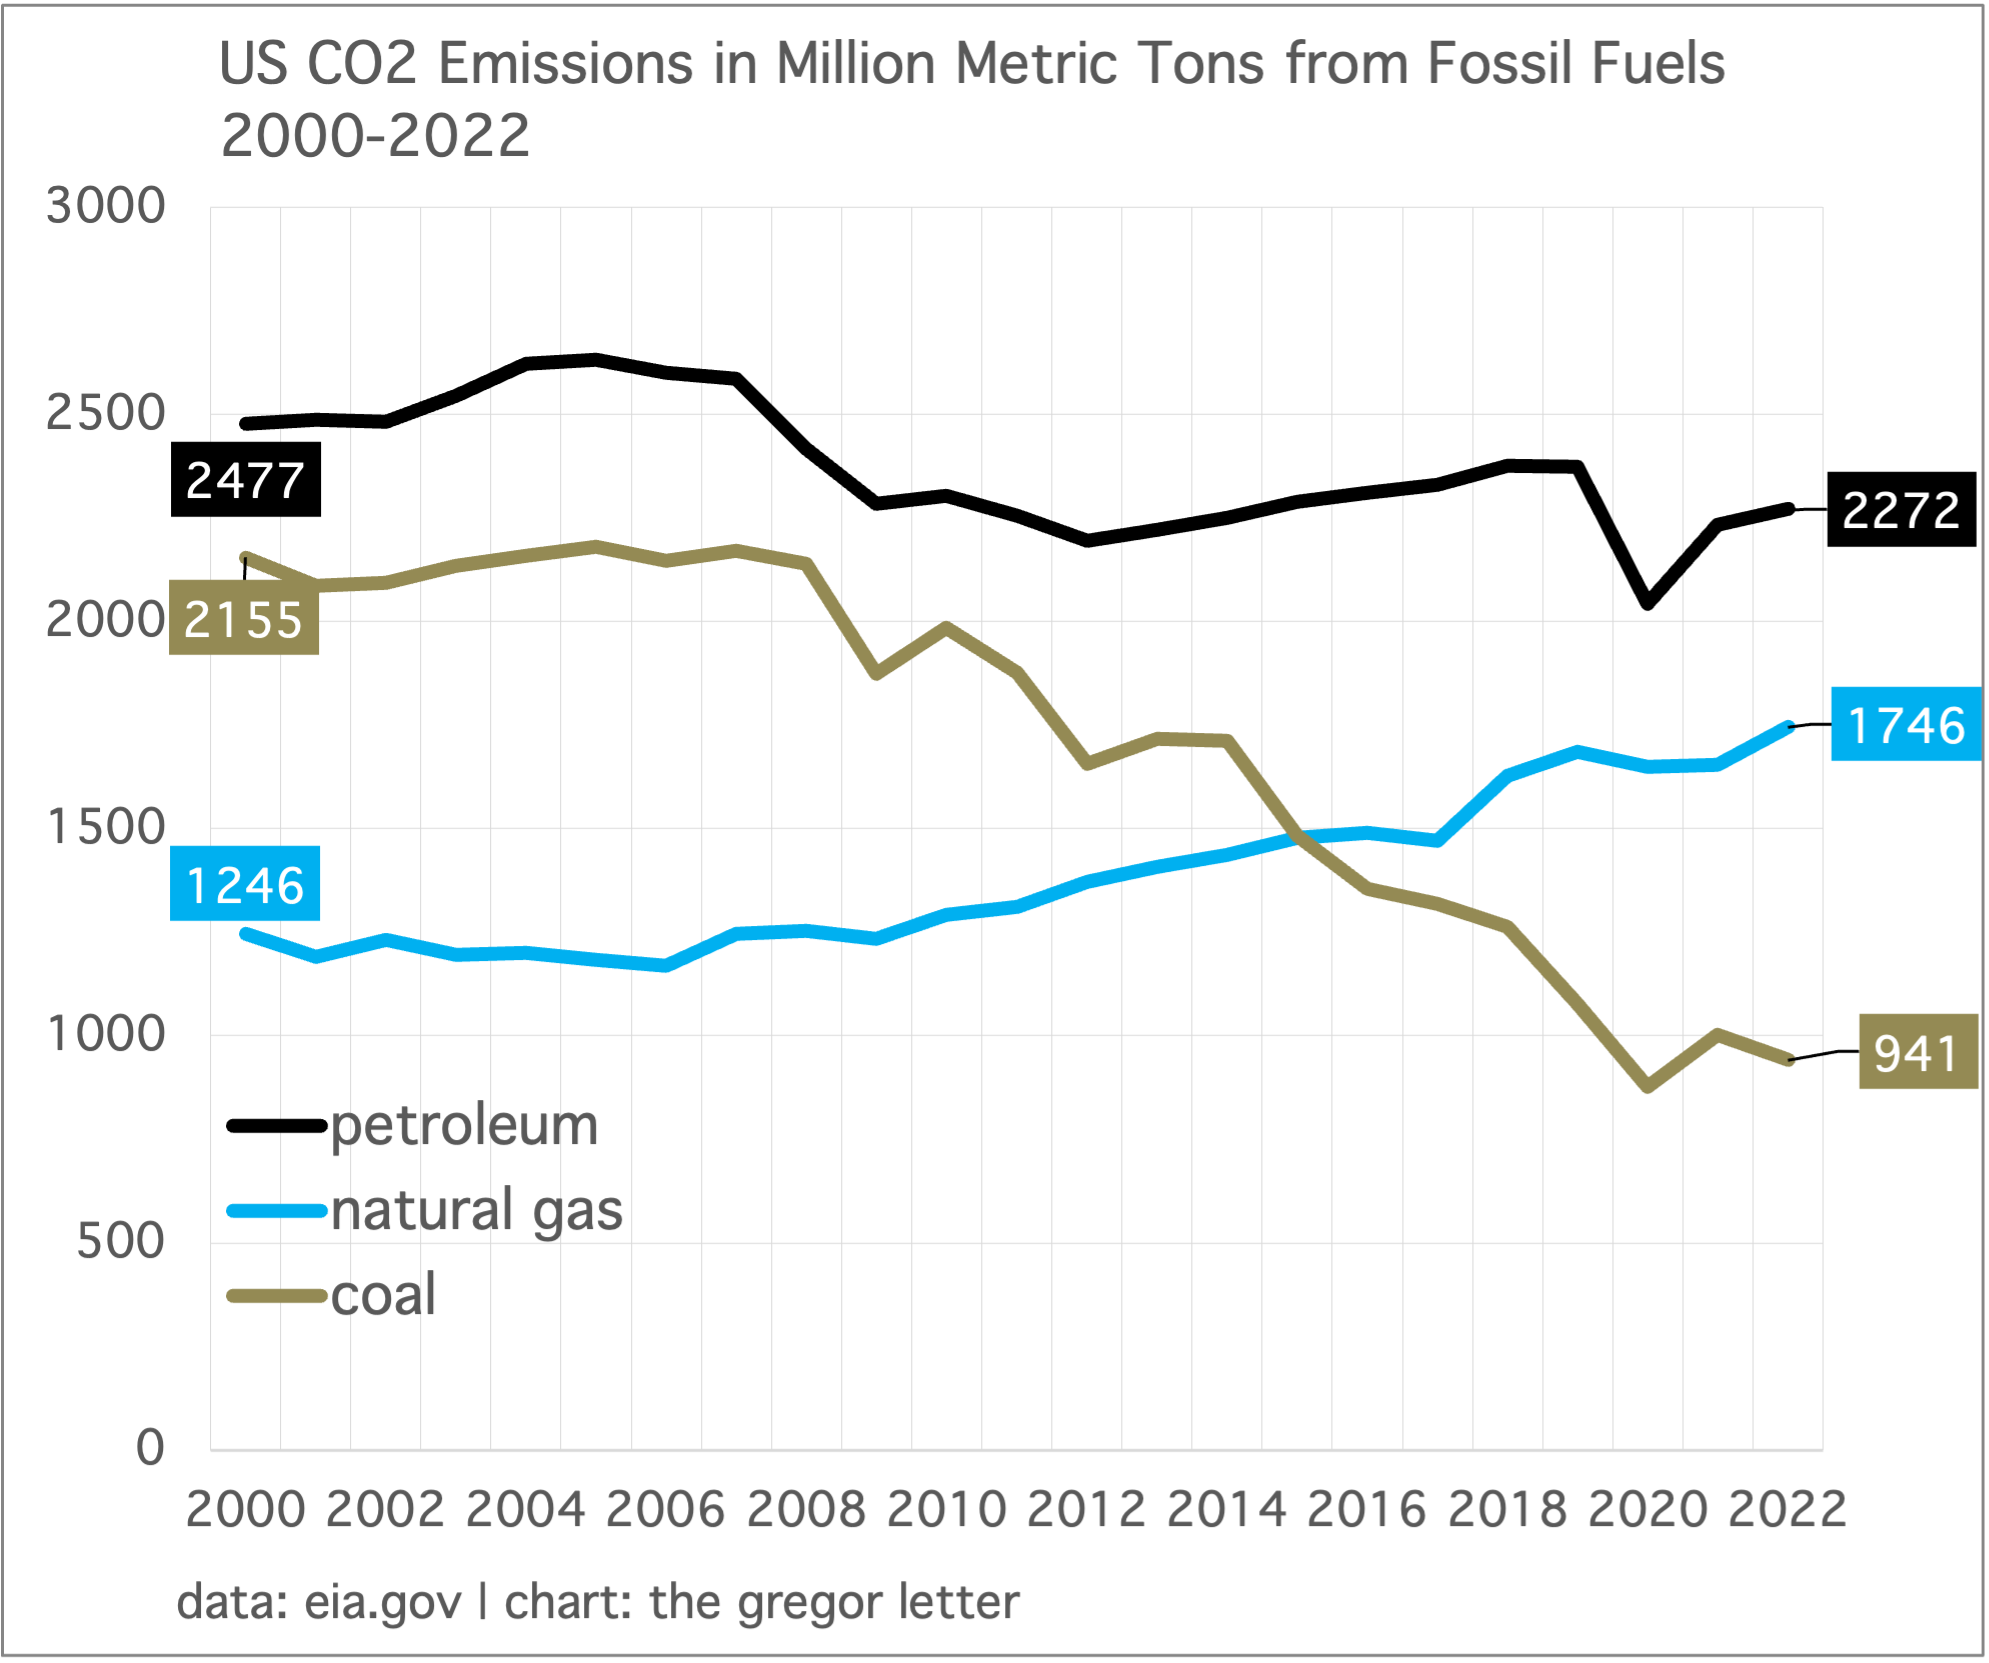
What happened? Well, the US continues to do little about its petroleum dependency, and the large harvesting gains we made through a decade of coal retirements have slowed down. Meanwhile, natural gas has grown quickly, and since the year 2010 has clawed back nearly half the emissions declines we secured by killing coal.
The accounting here just isn’t that complicated. US emissions declined 14.7% from 2007, to 2017. But if the current pace is maintained, starting from 2017 forward, US emissions would only fall 6% through 2027.
It must be said: getting emissions to decline is hard work. But if you are not pulling yet on the petroleum lever, and are getting killed by natural gas growth, then pulling harder on the coal lever is simply not enough. Fighting coal is quickly becoming a “fighting the last war” problem. Obviously we want to kill coal further, but coal is a battle while emissions are the war. And the rate at which we’re fighting the war is slowing, just as we need the rate to be accelerating.
For a more detailed view (and because all the full year emissions data was just released by EIA) let’s add a second chart here showing emissions from the three main fossil fuels. | math note: if you sum the CO2 emissions from the three fossil fuels shown here, your total will reach 4959 million tonnes. That’s 11 million tonnes short of the 4970 million tonnes shown in the previous chart. What accounts for the difference? This: non-biomass waste burned in electricity production.
Japan’s cherry blossoms have once again emerged early. Way too early. Perhaps you knew, or perhaps you didn’t, but cherry blossom data from Japan tracks extremely well with the industrial revolution, as global output of CO2 began to raise global temperatures, thus pushing the blossom season backwards. Depressingly, this year’s blossoming came even earlier than expected, tying the record.


The cost of offshore wind continues to fall, though not in a straight line. Without question one of the more astonishing learning curve outcomes of the past decade has been seen in offshore wind. We must thank the early entrants, Europe and the UK, for this inheritance. In 2022 for example, 7GW of new offshore wind was contracted in the UK at an average of $54/MWh, compared to an average of $147/MWh in 2014-2015. And those mid-decade figures were of course alot lower compared to the industry’s first baby steps, twenty years ago.
Inflation however has interrupted this cost decline, unsurprisingly. In the US, one developer, Avangrid, has asked to renegotiate its previously contracted cost to build the 1.2 GW Commonwealth offshore wind project, asserting that purchase power agreements (PPAs) are no longer viable at $72/MWh. If you are wondering why the US price is so much higher than in Europe, the simple answer of course is that a robust supply chain built over two decades, along with skilled labor and expertise, benefits all new projects in the UE/UK market. Here in the US, we have only just begun to build. Everything from port investments to the procurement of specialized ships lies ahead of us.
This week, the Energy Department updated its offshore wind strategy and declared the US needs to see offshore wind costs fall from a current estimated average of $73/MWh to $51/MWh by 2030. Well, that’s probably going to happen anyway simply as the result of deployment. But again, that decline will not travel a straight line.
US power prices remain low and stable compared to the rest of the world. Indeed, the average price of all sectors from commercial to industrial to residential has risen by only 2.5% in the ten years from 2013 to 2022. And it’s notable that last year of course saw a spike in global prices of coal and natural gas—which drove up power prices everywhere—because without 2022’s experience the longer-term price increase would be even lower, across all sectors. The chart below comes via the recently released Sustainable Energy in America Factbook, put out by the Business Council for Sustainable Energy in collaboration with BNEF. Two salient facts:
• The US – and North America in general – offers industrial customers some of the least expensive electricity in the world. Among the G-7 nations, the US offered the lowest average industrial power price of 7.2 cents per kilowatt-hour in 2021 (the last year for which there is complete data).
• The prices households pay for power in the US has been relatively stable over the past decade, rising just 12.5% in nominal terms from 2012 through 2021.

Along with US domestic investment legislation targeting new energy technology and semiconductors, cheap US power prices are sure to become an increasing factor in the renewed increase in foreign-direct-investment (FDI) into the US. According to the IMF, the US became the top recipient of global FDI in 2021.
US battery storage capacity is set to quadruple in just three years, to 2025. We’re going to need alot of storage, and thankfully we’re getting some. The US finished 2022 with roughly 7.5 GW of storage capacity and is heading to 30 GW. Globally, meanwhile, BNEF projects that total world capacity will reach 500 GW by 2030. Of course, battery storage growth projections are still understandably based on lithium-ion technology. But as we proceed into the decade, sodium-ion batteries are likely to ascend, and, we’ll learn more about iron-air technology that’s now emerging in the US. We will need those innovations, or others like them, because the world is far behind already in building storage.
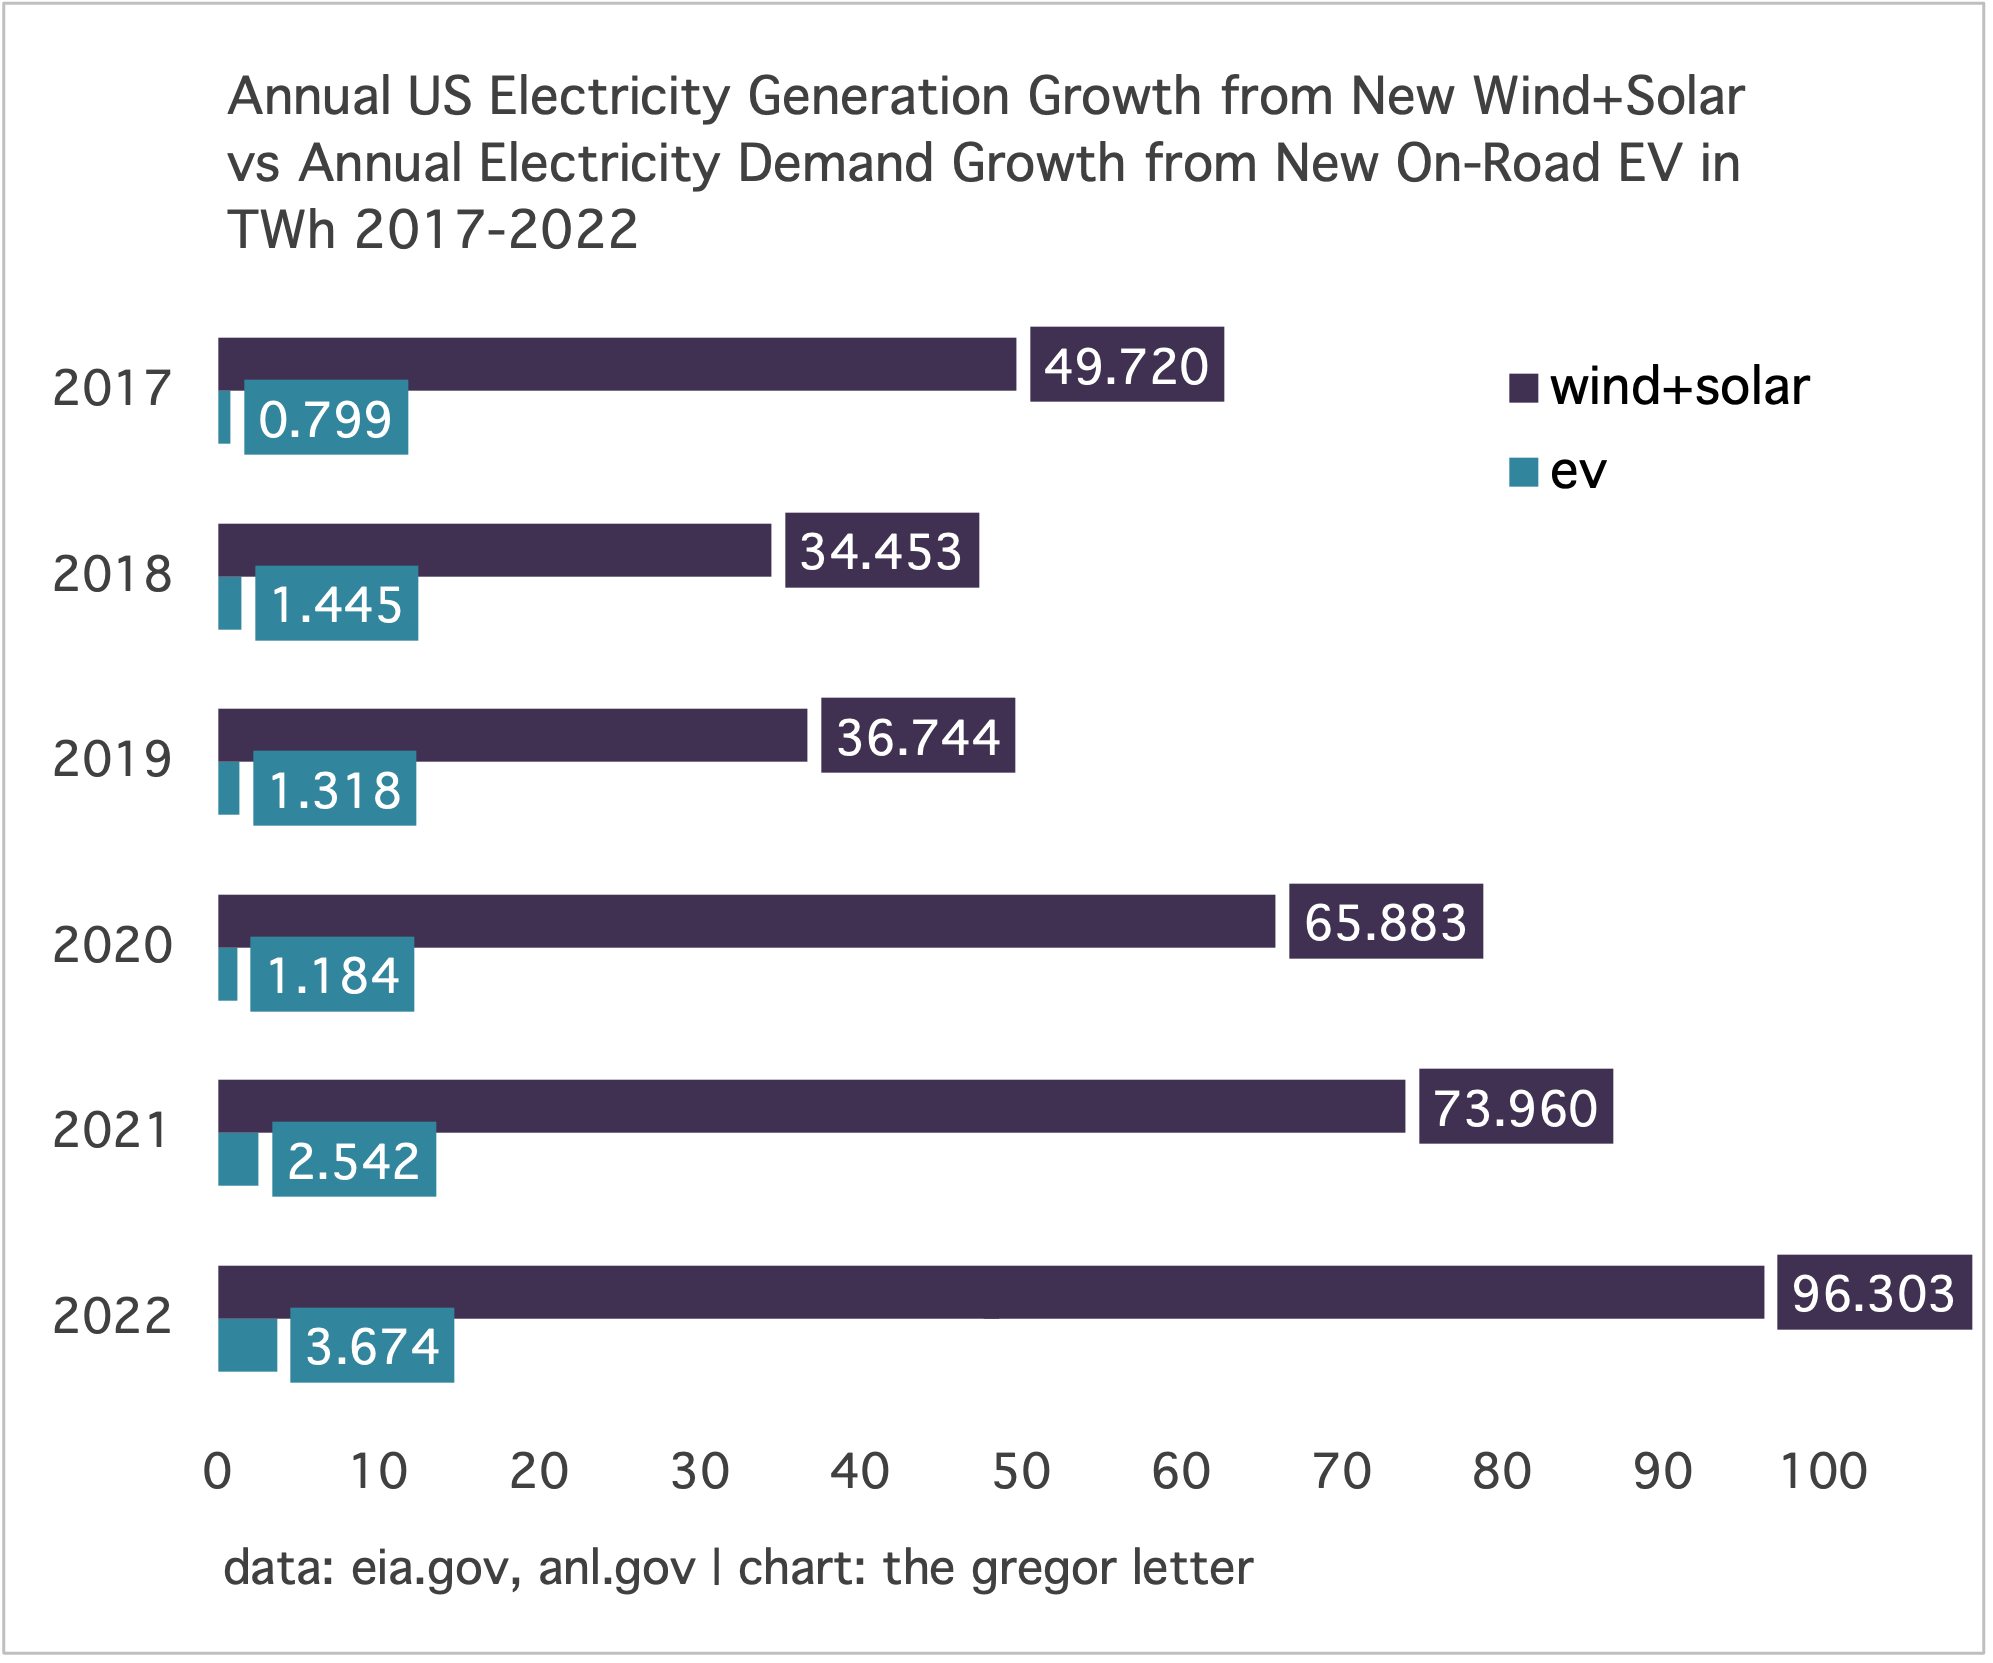
Annual growth of new electricity from wind and solar continues to dwarf new demand from on-road EV. This is true in China, Europe, and as shown here with now completed data for 2022, the United States. Last year, the US nearly put a fresh 1 million new plug-ins on the road (918,464) which means that nearly 4 new TWh of power were needed to run them. The calculation here is standard: the average US EV is expected to use 4000 kWh each year. Every million new EV on the road therefore would require 4 TWh, and last year’s new sales require 3.674 new TWh of generation.
But as you can see, the US could have put twenty-four million new EV on the road last year, because new generation from new wind+solar grew by an astonishing 96 TWh. In fact, because a portion of these plug-ins are hybrid, the demand estimate you see here is conservative (overestimated). In other words, as long as we have an EV market composed of both pure 100% EV and hybrid plug-ins, actual realized demand probably falls below 4000 kWh per vehicle.
Turning our attention to ongoing power needs of the cumulative EV fleet now on-road in the US, one can just sum the TWh estimates for the past six years to get a rough figure of 10.96 TWh. (The better calculation would attempt to estimate the total on-road EV fleet but that data is not available. That said, sales were scant in the US for a long while). What to conclude? Well, electrification of transport is now taking off finally in the US, and is absolutely going to show up as notable, annual calls on power supply. Let’s be super conservative and over-estimate that the total US EV fleet currently demands 20 TWh of electricity each year. And then more reasonably, that as we scale up from a million new sales each year, we’ll need to add 4 TWh for each million new EV sold, adding to the cumulative total as each year passes by.
By the end of 2025, for example, let’s add a conservative 15 new TWh of demand to the current fleet demand estimate of 20 TWh, for a total of 35 TWh. For a system that uses 4300 TWh already, we can easily meet all that growth through the deployment of new wind, solar, and grid storage batteries. The real question however—the question that is becoming increasingly salient—is how will we force energy sources ex-renewables into decline, unless we start to overwhelm the system with an array of new, clean sources of energy? Without overwhelming force, we are either on a very slow path to decarbonization, or, worse, we are merely meeting total annual demand growth, both in powergrids and outside of powergrids, with clean sources—thus leaving legacy demand and legacy dependency fully intact.
—Gregor Macdonald
The Gregor Letter is a companion to TerraJoule Publishing, whose current release is Oil Fall. If you've not had a chance to read the Oil Fall series, the 2018 single title is newly packaged and now arrives with a final installment: the 2023 update, Electric Candyland. Just hit the picture below to be taken to Dropbox Shop.
